


What Caused the Bitcoin Crash in May?
Market Manipulation and Free Markets

The entire time that the market was crashing from $60k to $30k, I was searching for answers. How could such a crash take place? I was under the pretence that Bitcoin had reached some newfound price stability in 2021. After all, institutional investors and big business had started piling in, and the retail investor base was stronger than ever. On my quest for answers, I managed to find three that I found compelling enough to satisfy my curiosity, and leave me with armed with more knowledge than before the crash. I have more indicators to watch out for, and less naivety when crafting my strategies.
1. Too Much Leverage in the System
What does it mean for there to be too much leverage in the system? Basically, too many people took on debt, to buy Bitcoin, myself included. Intelligent traders can recognize that too many people are going long, and bet against the market. If they get the price moving in the right direction, they can cause a price cascade. This is when lower prices triggers automatic sell-orders, which brings prices lower, which triggers lower automatic sell-orders. In this way, short traders can manipulate this market, and bring the price lower and lower in a pretty short period of time. This is exactly what we saw.

Each time Bitcoin made a new low, the traders that were going long, doubled down. The lower the price, the more enticing it was for them to increase the size of their long position. This backfired for many traders as the price kept on dropping in sudden selloffs that took place within the span of 15-30 minutes.
Is this Market Manipulation?
I would say it is. But this is what a truly free market looks like. Mrugakshee and I were discussing market manipulation this week in the context of Bitcoin and GameStop. If you have enough capital at your disposal, then you absolutely have the ability to “push the price around”. In a free market, those with more capital are able to exercise their freedom.
With respect to what happened with GameStop, I am inclined to say that the stock market doesn’t quite hold the same title of being a “free market”. When centralized authorities are able to shut off markets, and stop a viral trade from taking place, this is censorship. Where were these centralized authorities when retail Bitcoin traders were losing money in the middle of May? They don’t exist, and we like it that way.
Bitcoin shed almost a half of $1 trillion off of its market cap during this selloff, and no one got a bailout. Thats the harsh free market conditions real Bitcoiners signed up for.
2. Too Much FUD Triggered Panic Selling
I’d like to build on the narrative I presented above, (short traders pushing triggering price cascades). One major reason short traders were able to push the price down so much, is by capitalizing on the amount of FUD in the media. By timing large sell orders with unfavourable news, they were able to convince market participants that a crash was imminent.
The whole sell off seemed to be triggered by a tweet by Elon saying that Tesla was suspending Bitcoin transactions1. This brought the price down to $46k over the course of a couple of days. Then Elon replied “Indeed”2 to a tweet suggesting that Tesla would be parting with their Bitcoin holdings. This lowered Bitcoin to an even $42k. Finally, China released a notice saying they were banning companies from providing services related to cryptocurrency3.
The Fear and Greed Index
I recommend you check out the Bitcoin Fear and Greed Index by alternative.me. They’ve put together a model based on volatility, market volume, social media, trends, and Bitcoin dominance to spit out a number between 0 and 100 representing the amount of fear (0), and greed (100) in a market. On May 24th, we hit a very low fear value of 10, which is classified as extreme fear. After each one of the events mentioned above took place, followed a new level of fear within the market. News triggers fear, fear triggers panic selling, panic selling triggers lower prices, more bad news triggers greater fear.
China Historically Triggers SellOffs
The below chart shows the price of Bitcoin from 2013 to present. It shows major press releases by China, and its effect on the price of Bitcoin. Anytime China “bans” something to do with cryptocurrency, the market dumps.
There is a saying in the trading world — “Buy the Rumour, Sell The News”
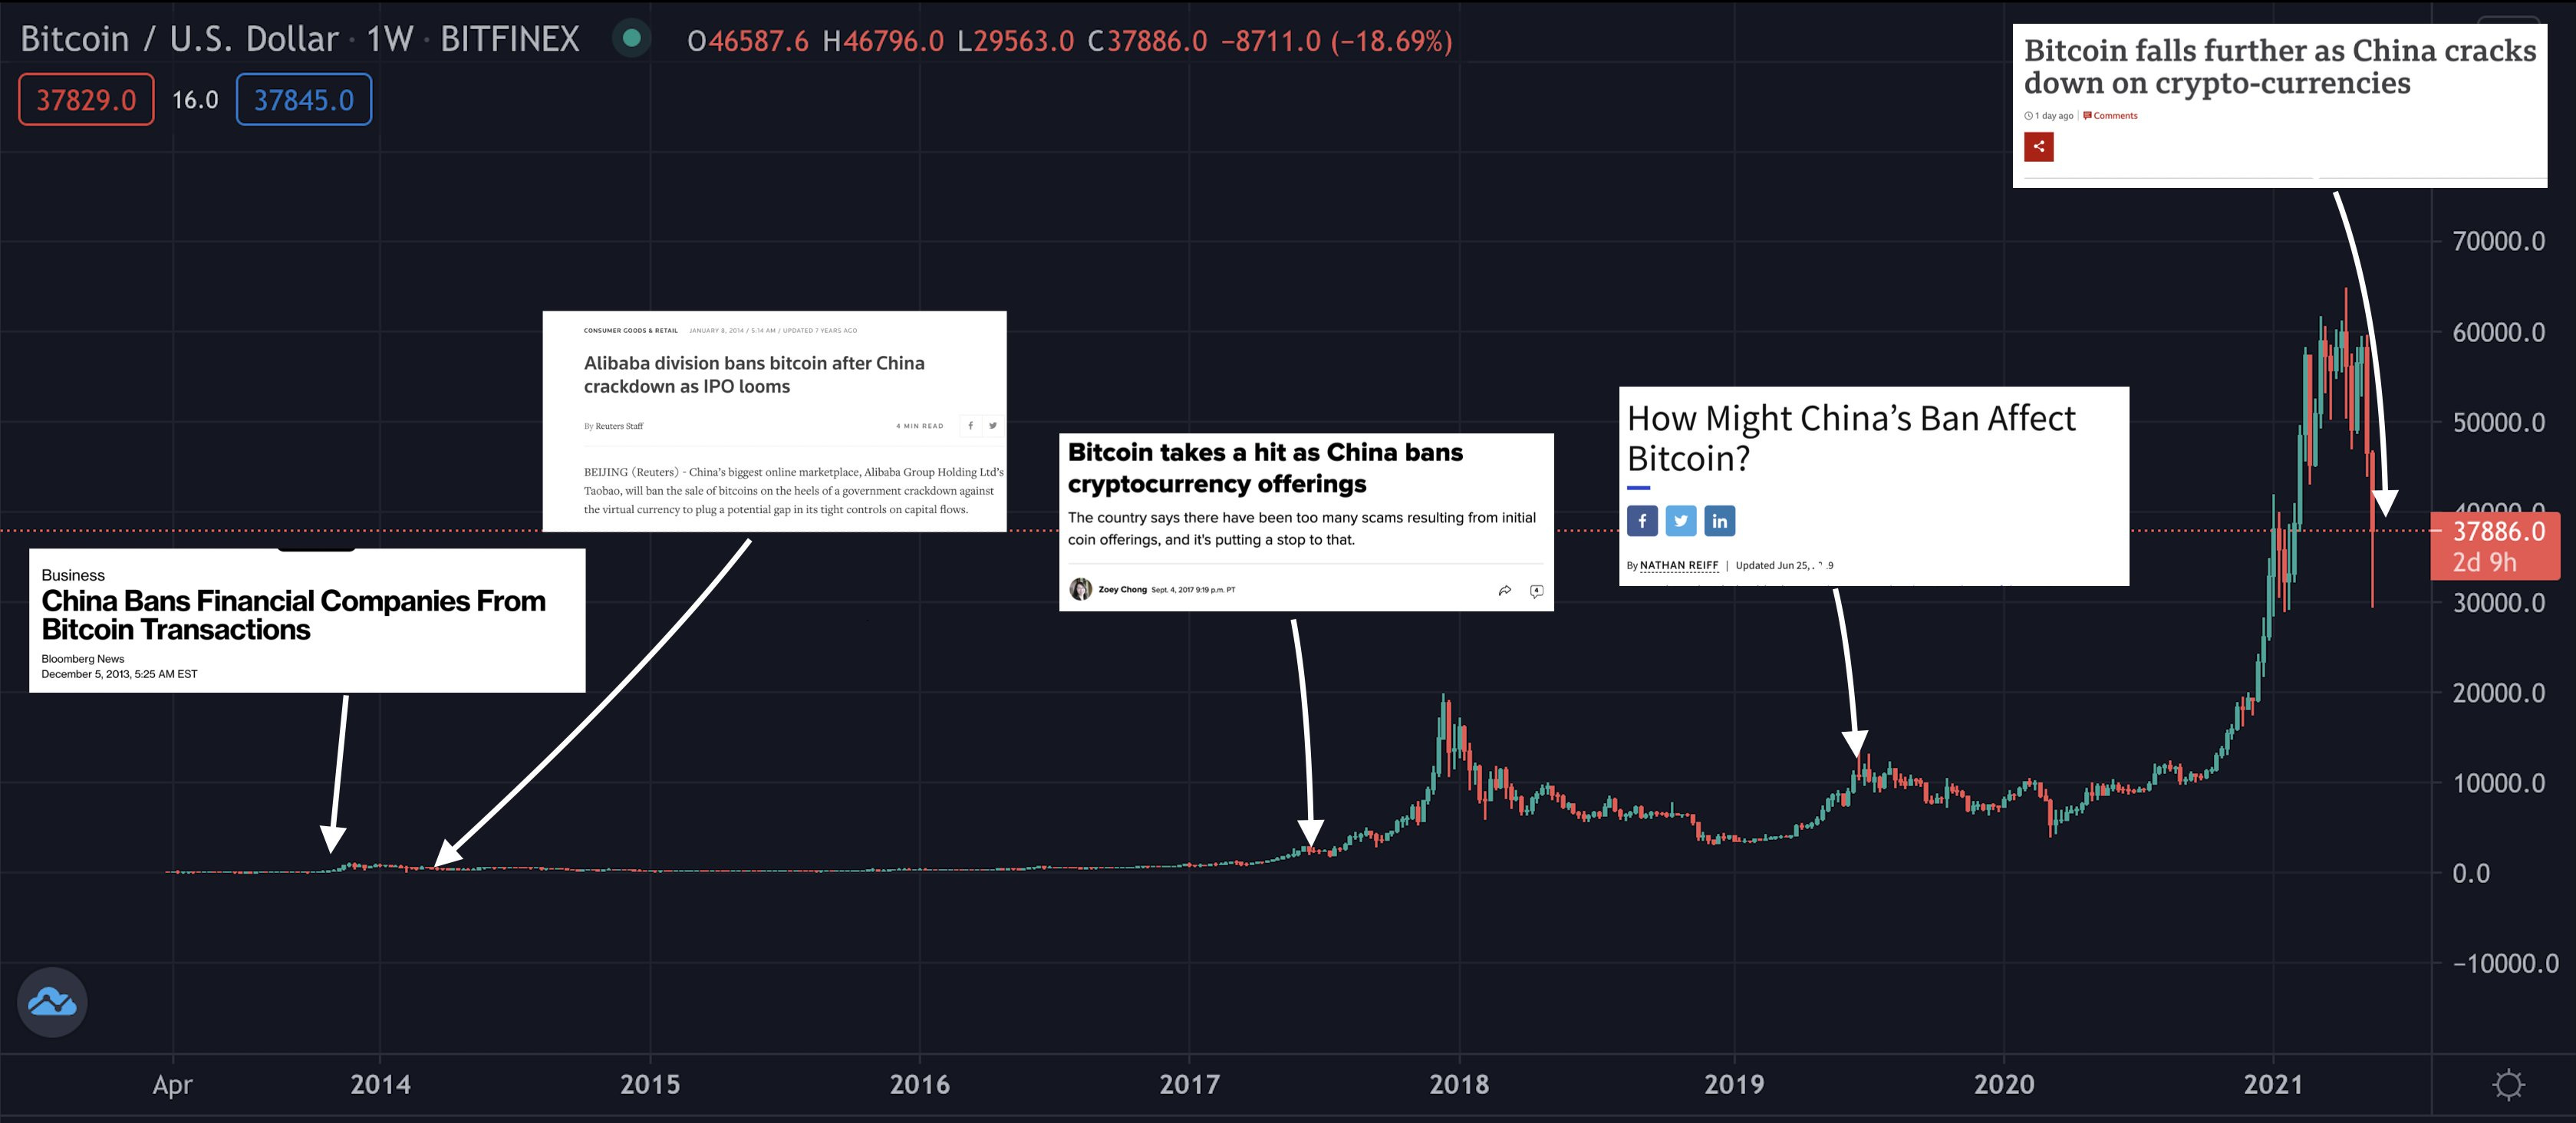
If this latest press release wasn’t a coincidence, then it was a well-timed event to add insult to injury. China kicked Bitcoin when it was down, and brought it to a crippling $28-30k range. Maximum fear.
3. On-Chain Metrics Signalled Selling
There is a class of Bitcoin traders that stick very closely to "on-chain” metrics. That is, data derived from information available to everyone. On-Chain analysis is done on the Bitcoin blockchain and yields metrics such as address inflow/outflow, transaction volume, dormant addresses, and a host of other potentially useful numbers.
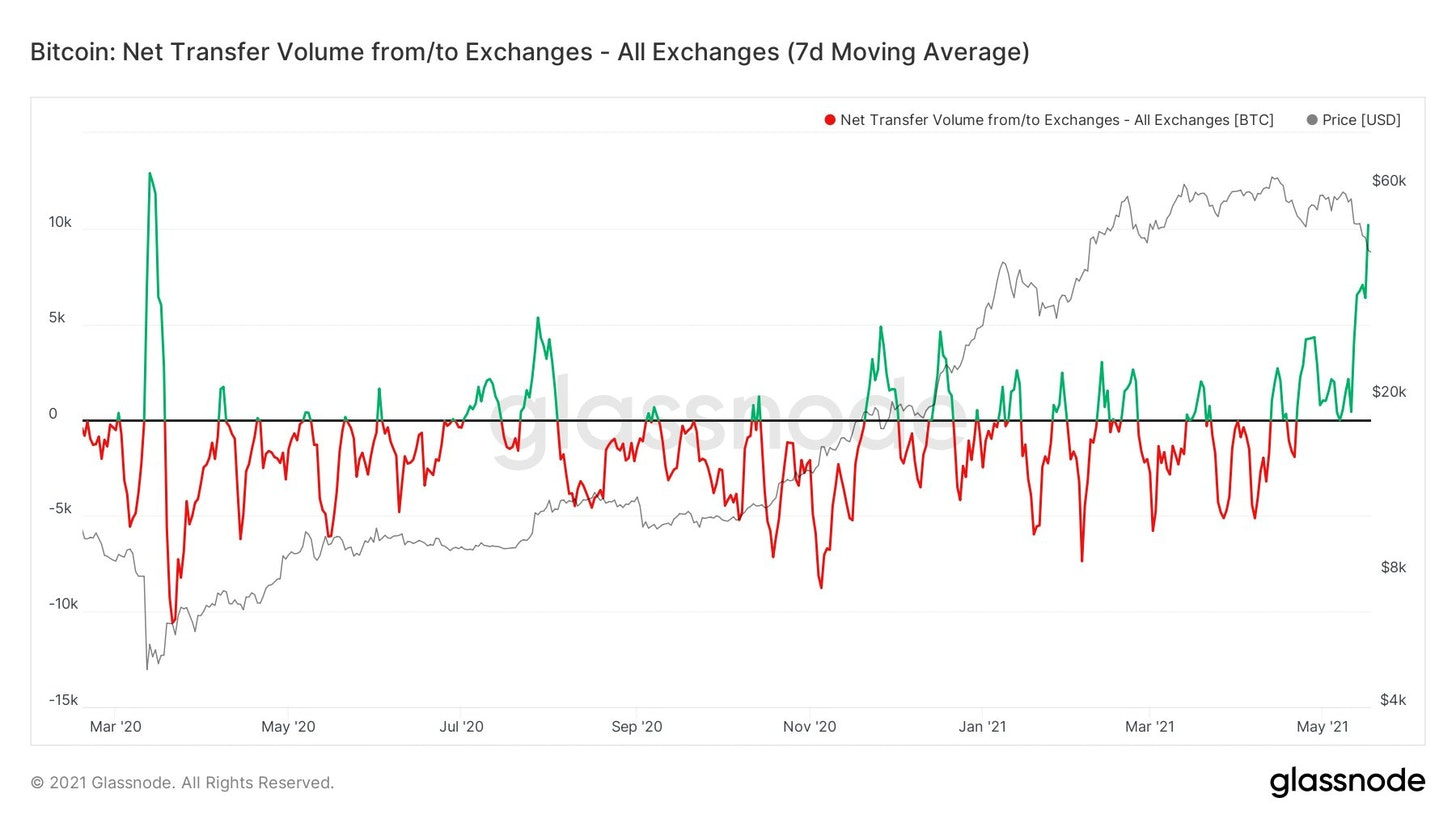
The above chart shows net inflow/outflow of Bitcoin into/out of exchanges. When there is a lot of Bitcoin being transferred to exchanges, we can usually assume they are being moved there to sell. This is backed up by historical evidence, but we can also just look at the crash that took Bitcoin from $42k to $30k. The green line peaked in the above chart on May 18th when Bitcoin was still at $42k.
Advanced traders can look at this, and factor it into their short-term strategy. Long term hodlers may just find this a fascinating bit of information as they watch the market rip itself apart.
4. No Cause — Just a Healthy Market Correction
Bitcoin was up 1,000% from March 2020 to March 2021. These sort of gains require healthy market corrections, and this was one of them. These corrections do several things for a market.
Drain the over-leveraged positions in the market
Shake-Out short term traders
Allow retail investors, and long term holders to accumulate at lower price
There is a model designed specifically to describe exactly what happened with Bitcoin over the last month. It’s called the Wyckoff Method4.

If this chart looks familiar, it’s because you just lived through it.
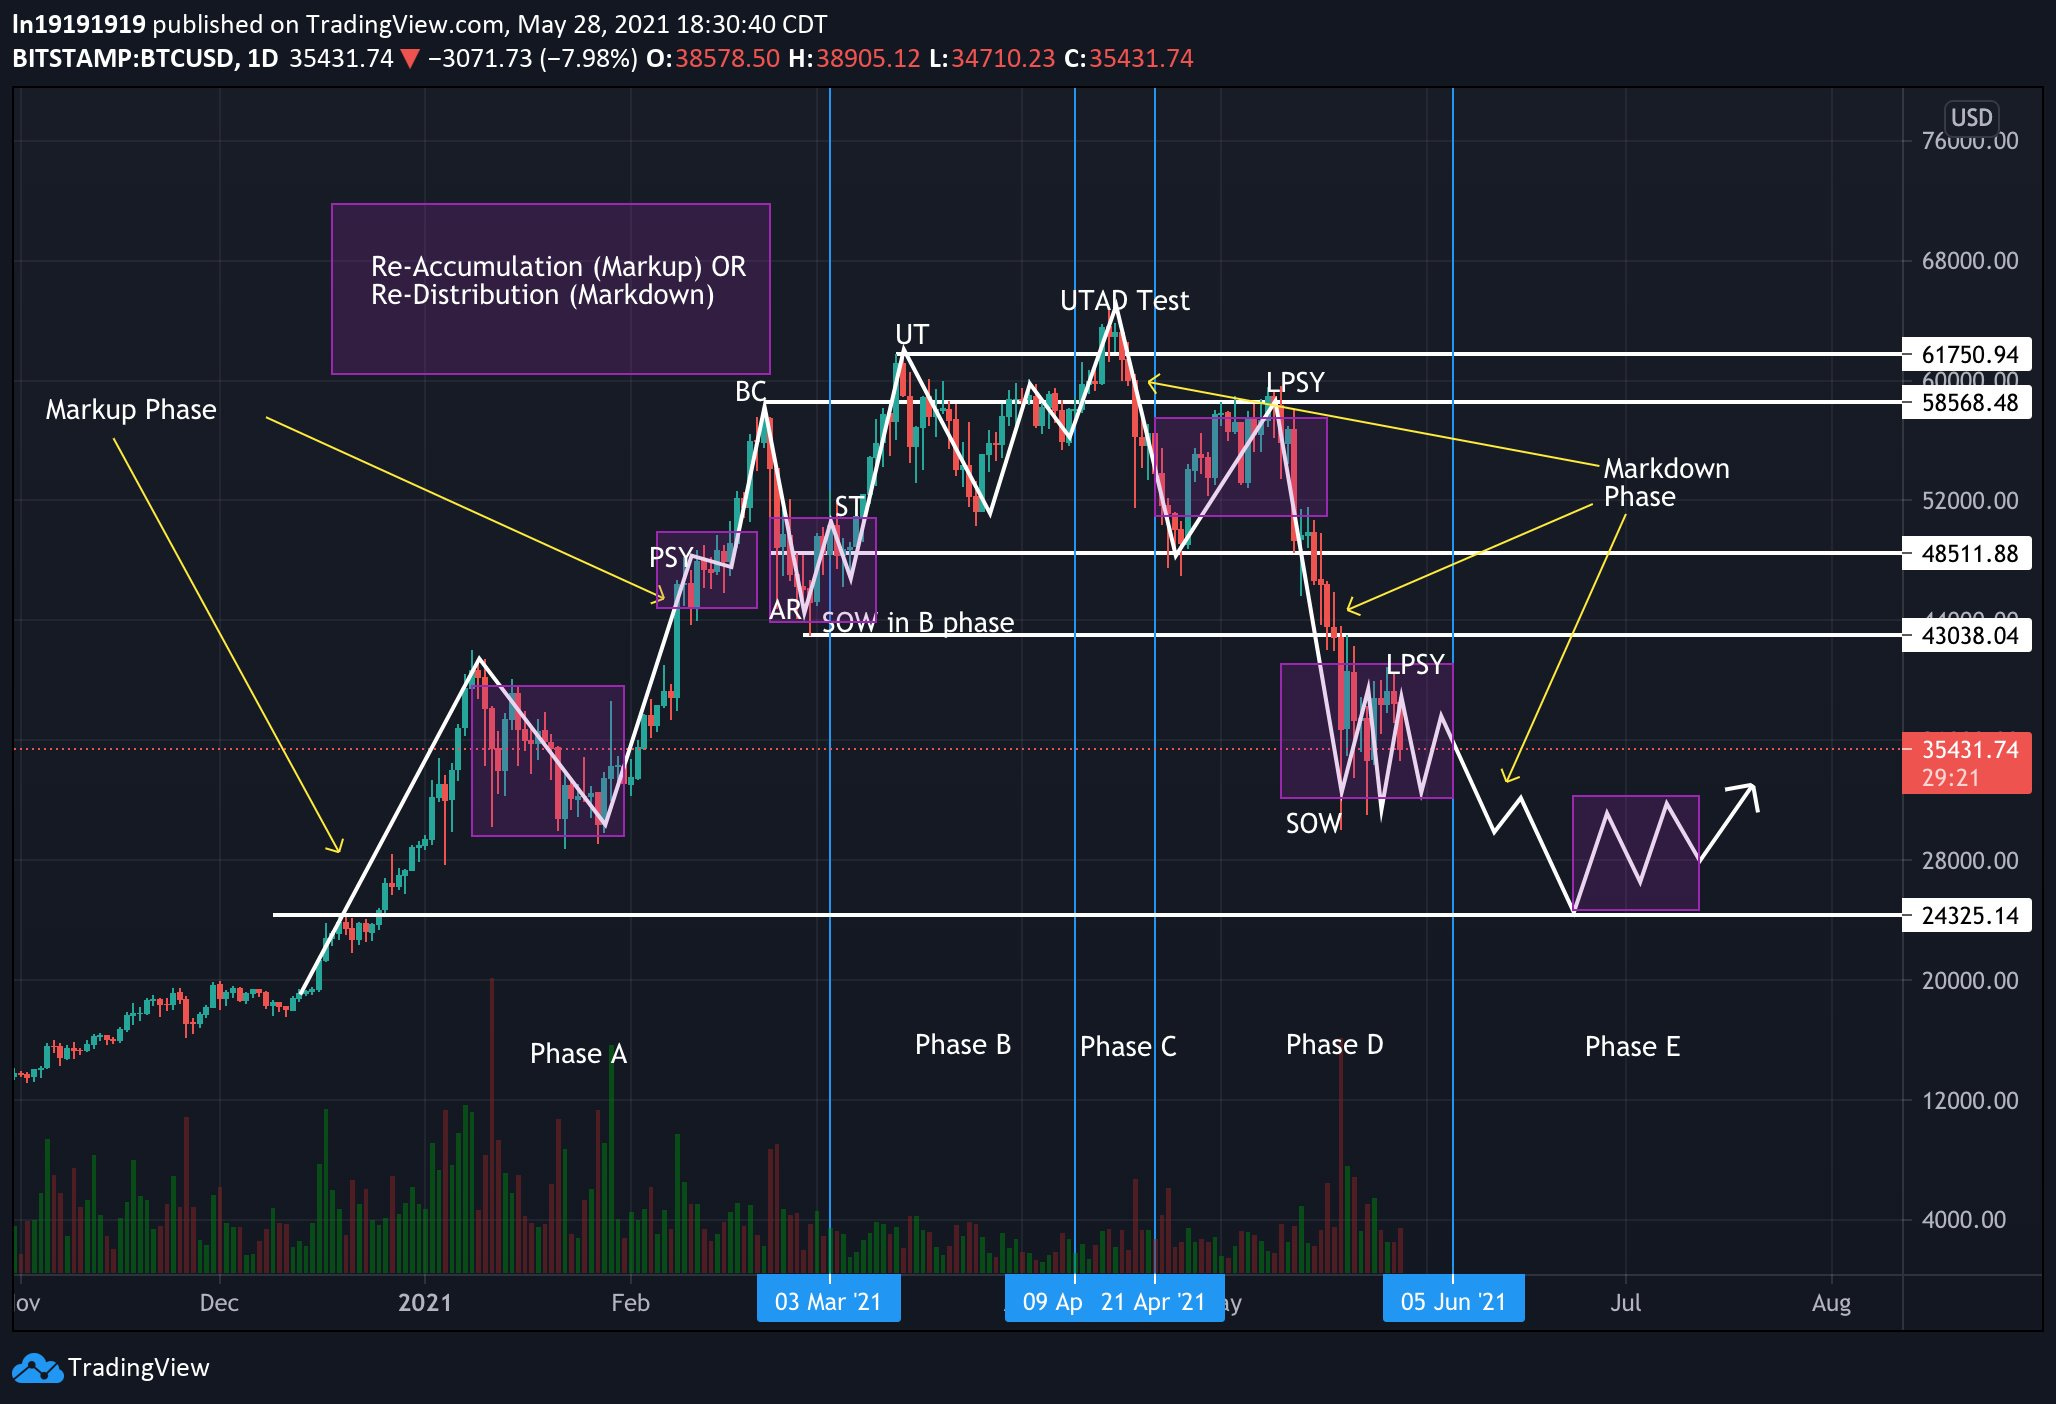
After the cycle ends, a sort of “market reset” takes place, and new patterns will take some time to emerge.
What Comes Next?
What happens after this is anyone’s guess. As I write this letter we’re trading sideways between $32k and $40k. We test key resistance points on either side about twice per week. I’m definitely taking more of a hodler perspective until the current market conditions develop a bit more. I still expect Bitcoin to reach a new all time high in the later part of the year, but the next few months are a bit of a mystery for me.
For now, I’m staking Bitcoin at cheaper prices, and learning more about on-chain analysis. Expect me to be including more on-chain analysis in future letters.
Cheers,
Keegan Francis
Resources
Cryptocurrency Memes / Podcasts / Charts - pass: v5HP7yBZAzuGVVJ&
Great Article, I'm learning also